Case study 2: Vowel dynamics
Author : Massimo Lipari
Motivation
It has long been known that even vowels traditionally described as monopthongs show gradual changes in formant frequencies over the course of the segment, which appear to be play a significant role in phoneme identification [Hillenbrand et al., 1995, Nearey and Assmann, 1986]. This phenomenon, referred to as vowel-inherent spectral change, motivates analyzing whole formant tracks, rather than reducing observations to point measures (e.g., formant frequencies at vowel midpoint).
Vowel-inherent spectral change is by now well-documented in English, but comparatively less so in other languages. Here, we’ll be investigating formant dynamics across the vowel system of Quebec French.
- This case study demonstrates workflows for formant measurement in PolyglotDB:
Default
Using prototypes
Incorporating an external tool for manual measurement
Step 0: Preliminaries
For this case study, the data come from a corpus of parliamentary speech, the ParlBleu corpus [Lipari et al., 2024]. We’ll be using a subset of 6 speakers (3 female, 3 male), which can be downloaded here. The full corpus is also available on GitHub by request.
To begin, we’ll assume a file structure that looks like the following:
pgdb_case-studies (your working directory)
├── ParlBleu-subset (the corpus data)
│   ├── enrichment_data
│       │       ├──     prototypes.csv (discussed later)
│   │   └── speaker_metadata.csv (a file containing speaker metadata)
│   ├── * (one folder for each speaker's data)
├── vowels
│   ├── output
│       │       └── * (starts out empty, output files will be generated here)
│   ├── * (scripts go here)
Step 1: Importing
We first import the corpus into a PolyglotDB database, much like in Tutorial 1.
import polyglotdb.io as pgio
from polyglotdb import CorpusContext


def main():
    # Set the path to the corpus (change this if you've put the corpus in a different location)
    corpus_root = "../ParlBleu-subset/"

    # Set the name of the PolyglotDB database that will be created for the corpus (can be anything)
    corpus_name = "ParlBleu-subset"

    # This tells PolyglotDB that the TextGrids are in the *Montreal Forced Aligner* format
    parser = pgio.inspect_mfa(corpus_root)
    parser.call_back = print

    with CorpusContext(corpus_name) as c:
        c.load(parser, corpus_root)


if __name__ == "__main__":
    main()
Note
All the Python scripts in this case study us the so-called if __name__ == '__main__': idiom, where the code is wrapped in a function called main() that is executed only when the script is called directly. This is to avoid issues with the multiprocessing module.
Step 2: Enrichment
We now enrich the corpus with the information required for our case study.
We specify the set of phones which represent vowels in the corpus in the
vowel_setvariable. We then automatically syllabify all words, in this case assuming that vowels and only vowels are syllabic in this language.We then specify the set of word labels used to represent silences in the corpus with the
pause_labelsvariable. This allows us to split sound files into ‘utternaces’–periods of speech surrounded by periods of silence of a predetermined minimum length (150 ms by default, but this can be changed by modifying themin_pause_lengthparameter to theencode_utterances()function).Finally, we want to add basic biographical information about the speakers (e.g., gender, year of birth), which we have stored in the
speaker_metadata.csvfile. The values in the first column of this file must match the PolyglotDB speaker ID (the name of the folder containing that speaker’s data); every other column is used to create new properties of speakers in the database (with the column name used as the property name).
from polyglotdb import CorpusContext


def main():
    # Remember to change this if you changed it in step 1
    corpus_name = "ParlBleu-subset"

    # Specify the vowel set for this corpus
    vowel_set = [
        "a",
        "e",
        "i",
        "o",
        "u",
        "y",
        "ø",
        "œ",
        "œ̃",
        "ɑ",
        "ɑ̃",
        "ɔ",
        "ɔ̃",
        "ə",
        "ɛ",
        "ɛ̃",
        "ɜ",
    ]

    print("Encoding vowel set...")
    with CorpusContext(corpus_name) as c:
        c.encode_type_subset("phone", vowel_set, "vowel")

    print("Syllable enrichment...")
    with CorpusContext(corpus_name) as c:
        c.encode_type_subset("phone", vowel_set, "syllabic")
        c.encode_syllables(syllabic_label="syllabic")
        c.encode_count("word", "syllable", "num_syllables")

    print("Utterance enrichment...")
    # Specify the set of word labels which designate pauses
    pause_labels = ["<SIL>"]

    with CorpusContext(corpus_name) as c:
        c.encode_pauses(pause_labels)
        c.encode_utterances(min_pause_length=0.15)

    print("Speaker enrichment...")
    # Change this if you've moved the file on your computer
    speaker_enrichment_file = "../ParlBleu-subset/enrichment_data/speaker_metadata.csv"

    with CorpusContext(corpus_name) as c:
        c.enrich_speakers_from_csv(speaker_enrichment_file)


if __name__ == "__main__":
    main()
Step 3: Formant analysis
We are now ready to measure F1-F3 tracks for vowels in the corpus. There are two ways to do this entirely within PolyglotDB, which we demonstrate below. We’ll also show how one might go about using external software to obtain acoustic measures before loading this information back into a PolyglotDB database.
Option A: Quick and dirty
The easiest way to get formant tracks is to use the analyze_formant_tracks() function in PolyglotDB. This will ultimately call Praat in the background, looking for 5 formants with a ceiling frequency of 5500 Hz. These parameters are not guaranteed to produce sensible results for speaker-vowel pairs: accordingly, this method is not recommended, but included for completeness in case it’s sufficient for your purposes.
By default, analyze_formant_tracks() will generate acoustic tracks over entire utterances (which requires utterance encoding to have previously been performed). If we instead want formant tracks only over vowel intervals, we can use the vowel_label argument to specify the subset of phones for which formant tracks are desired. We simply enter the name of some previously encoded phone subset: in this case, the 'vowel' subset encoded in step 2.
from polyglotdb import CorpusContext
from polyglotdb.acoustics.formants.refined import analyze_formant_points_refinement


def main():
    corpus_name = "ParlBleu-subset"

    with CorpusContext(corpus_name) as c:
        # Set this for your computer
        c.config.praat_path = "/Applications/Praat.app/Contents/MacOS/Praat"

        print("Refined formant calculations...")
        c.analyze_formant_tracks(vowel_label="vowel")


if __name__ == "__main__":
    main()
Option B: “Refined” measures
Alternatively, PolyglotDB implements the formant ‘refinement’ algorithm described in Mielke et al. [2019] through the analyze_formant_point_refinement() function. In short, this approach generates multiple canadidate analyses for each vowel token by varying the number of formants (while keeping the formant frequency ceiling fixed at 5500 Hz), and automatically selecting the candidate which minimizes the Mahalanobis distance between the observation and the multidimensional distribution of the corresponding vowel phoneme in acoustic space, which is referred to as a ‘prototype’. For the implementation here, prototypes consist of means and a covariance matrix on 6 acoustic dimensions (the frequencies and bandwidths of the first three formants taken at 33% of duration) for each of the vowel phones being analyzed. The algorithm can be run with multiple iterations: new prototypes are computed for each speaker-phoneme pair at the end of each iteration and used for the following one.
To get formants tracks (rather than points), we add the output_tracks = True parameter. (This is admittedly a little confusing, given the name of the function.)
i. Getting vowel prototypes
By default, analyze_formant_points_refinement() automatically generates prototypes for the first iteration of the algorithm from first-pass acoustic measures (using the default paramters–5 formants and a formant ceiling of 5500 Hz). Since prototypes are only as good as the acoustic measures from which they are generated, this approach may not always be reliable. In our experience, however, even mediocre prototypes have produced better results than not doing any sort of ‘refinement’ (for example, using option A above instead), but your mileage may vary.
It’s possible to instead specify prototypes for each phone from a CSV file (for any phones lacking prototypes, the default method will be used instead). Ideally, these will have been generated from a decently-large set of robustly hand-checked formant measures obtained from data that are as representative as possible of the new data for which acoustic measures are being obtained. Here, we’ll use prototypes generated from hand measurements of 100 randomly sampled tokens of each of the 17 vowel phones from the ParlBleu corpus: these can be found in the prototypes.csv file. (If you use these in your own research, please cite Lipari et al., 2024.) The general method (but not the exact implementation details) used to generate these prototypes is shown below. (When re-running the scripts for yourself, you may skip to step ii.)
Making prototypes from scratch
A good way to obtain prototypes for a corpus is to hand-measure a random subset of vowels from the corpus at hand. For this, we’ll use the excellent Praat plugin Fast Track [Barreda, 2021]. Like PolyglotDB, Fast Track obtains multiple candidate analyses for every token and attempts to automatically select the best one, albeit in a slightly different way: the number of formants is fixed at 5.5, and the formant ceiling is manipulated within a user-defined range. The optimal candidate is determined based on the smoothness of the formant tracks (and optionally, also using some simple heuristics)–the idea being that excessive jitter is typically a sign of a formant tracking error (since articulators can only move relatively slowly and gradually). While convenient, this method is still suceceptible to errors (since it’s possible to have a candidate which hallucinates or skips a formant while having smooth tracks), and should not be trusted blindly. The beauty of Fast Track is that it allows the user to easily compare the different candidates visually against the spectrogram and override the automatic selection procedure as needed.
Before we can run Fast Track, we need to obtain the random sample of vowels we want to manually analyze. First, we run a simple PolyglotDB query for all vowel tokens of interest in the corpus. Here, we’ll require the vowels be at least 50 ms long in order to avoid any overly-reduced tokens.
from polyglotdb import CorpusContext


def main():
    corpus_name = "ParlBleu-subset"
    export_path = "./output/vowels.csv"

    # Step 2: Getting the discourse name, begin and end time
    print("Querying all word-final-syllable vowel tokens >= 50 ms in duration...")
    with CorpusContext(corpus_name) as c:
        q = (
            c.query_graph(c.phone)
            .filter(
                c.phone.subset == "vowel",
                c.phone.duration >= 0.05,
            )
            .columns(
                c.phone.utterance.speaker.name.column_name("speaker"),
                c.phone.discourse.name.column_name("discourse"),
                c.phone.utterance.speaker.gender.column_name("gender"),
                c.phone.utterance.speaker.yob.column_name("yob"),
                c.phone.id.column_name("phone_id"),
                c.phone.label.column_name("phone"),
                c.phone.syllable.label.column_name("syllable"),
                c.phone.word.label.column_name("word"),
                c.phone.word.transcription.column_name("transcription"),
                c.phone.begin.column_name("phone_begin"),
                c.phone.end.column_name("phone_end"),
            )
        )
        q.order_by(c.phone.discourse.name)
        q.to_csv(export_path)


if __name__ == "__main__":
    main()
We then use an R script to take a random subset of this data. From there, the script will create a new directory (called fasttrack here), where it’ll put a copy of the data in the correct format for use with Fast Track (see here for an explanation). A copy of each vowel token is extracted from its original sound file with 25 ms of padding on either end and saved as its own sound file in a sounds directory.
In order to limit the number of spurious candidates considered (and therefore maximize the efficiency and efficacy of the automatic winner selection algorithm), it’s helpful to keep the specified formant ceiling range relatively narrow. However, a relatively wide interval is often needed to accomodate the range of interspeaker variation. We can get around this tension by splitting our speakers into groups based on approximate vocal tract length and using different ranges for each group. Here, we’ll try and achieve this result by grouping speakers by gender. The script will automatically create separate female and male folders, and create a sounds folder within each where the appropriate sound snippets will be copied.
The script will thus produce the following folder structure:
fasttrack
├── female
│   ├── sounds
│       │       └── * (extracted sound files will appear)
├── male
│   ├── sounds
│       │       └── * (extracted sound files will appear)
(We could instead analyze each speaker seperately by setting split_sounds_by = 'id' in the script.)
library(tidyverse)
library(tuneR)

corpus_root <- '../ParlBleu-subset'

# Parameters for sampling
set.seed(76)
sample_size <- 5

# Parameters for Fast Track
fasttrack_dir <- './fasttrack'
split_sounds_by <- 'gender' # This can be the name of any column in the `vowels` dataframe
sound_file_padding <- 0.025


# Sampling ----------------------------------------------------------------

# Load the datasets
vowels <- read_csv('./output/vowels.csv')

# Get a sample for prototypes, balanced for phone and for gender
vowels_sample <- vowels %>%
  slice_sample(n = sample_size,
             by = c(phone, gender)) %>%
             arrange(phone, gender)

# Save the sample
vowels_sample %>%
  write_csv('./output/vowel_sample.csv')


# Creating directories and sound files for Fast Track ---------------------
resave_wav <- function (input_wav, output_wav, begin = 0, end = Inf, units = 'seconds') {
  wav <- readWave(input_wav, from = begin, to = end, units = units)
  writeWave(mono(wav), output_wav)
}

create_fasttrack_folder <- function (split_sounds = 'gender') {
  dir.create(fasttrack_dir)

  # Create subdirectories to run separate analyses on
  subdirectories <- vowels_sample %>%
    pull({{split_sounds}}) %>%
    unique() %>%
    paste(fasttrack_dir, ., 'sounds', sep = '/')

  subdirectories %>%
    lapply(dir.create, recursive = TRUE)

  # Create sound files containing just the vowel token (+ padding)
  vowels_sample <- vowels_sample %>%
    mutate(input_wav_path = paste(corpus_root,
                                  speaker,
                                  paste0(discourse, '.wav'),
                                  sep = '/'),
           output_wav_path = paste(fasttrack_dir,
                                   get(split_sounds),
                                   'sounds',
                                   # paste0(phone, '_', phone_id, '.wav'),
                                   paste0(phone_id, '.wav'),
                                   sep = '/'))

  for (row in 1:nrow(vowels_sample)) {
    curr_row <- vowels_sample[row,]

    resave_wav(curr_row$input_wav_path,
               curr_row$output_wav_path,
               begin = curr_row$phone_begin - sound_file_padding,
               end = curr_row$phone_end + sound_file_padding)
  }

}

create_fasttrack_folder(split_sounds_by)
We can now run the Fast Track analysis: see Santiago Barreda’s tutorials for instructions. We’ll obtain 20 candidates using the formant ceiling range of 4000–6000 Hz for male speakers and 4500–6500 Hz for female speakers, and output 3 formants. Once this finishes, feel free to edit the winners.csv files to select alternate analyses, or to edit formant tracks directly, as desired. (Note that this is not done for this example.)
We now run another R script to collect the final acoustic tracks for all tokens into a single CSV file.
library(tidyverse)

tokens <- read_csv('./output/vowel_sample.csv')
sound_file_padding <- 0.025

# Create a single dataframe for all the acoustics
acoustics <- data.frame()
winners <- data.frame()

sound_dirs <- list.dirs('./fasttrack', recursive = FALSE)

for (d in sound_dirs) {
  winners_temp <- read_csv(paste(d, 'winners.csv', sep = '/'), na = '')

  winners <- winners %>%
    rbind(winners_temp)

  d <- d %>%
    paste0('/csvs')

  sounds_list <- list.files(d)

  for (sound in sounds_list) {
    sound_csv <- read_csv(paste(d, sound, sep = '/')) %>%
      # mutate(phone_id = str_split_i(sound, '_', 2) %>% str_split_i('\\.', 1),
      mutate(phone_id = sound %>% str_split_i('\\.', 1),
             .before = everything())

    sound_csv <- sound_csv %>%
      mutate(time = time - sound_file_padding)

    acoustics <- acoustics %>%
      rbind(sound_csv)
  }
}

tokens_with_acoustics <- tokens %>%
  right_join(acoustics,
            by = 'phone_id') %>%
  rename_with(~ str_to_upper(.x), .cols = f1:b3) # Make the column names uppercase for consistency with other scripts

tokens_with_acoustics %>% write_csv('./output/vowel_sample_fasttrack.csv')
Finally, one last R script (adapted from code on this GitHub repository) is used to interpolate the tracks to the 33% point before obtaining the means and covariance matrix for each phoneme: this gives us our prototypes file.
library(tidyverse)

measurement_point <- 0.33
proto_parameters <- c('F1', 'F2', 'F3', 'B1', 'B2', 'B3')
formants_path <- './output/vowel_sample_fasttrack.csv'
prototypes_path <- './output/generated_prototypes.csv'

# Load the formant data (from Fast Track)
formant_data <- read_csv(formants_path)

formant_data <- formant_data %>%
  mutate(time.rel = time / (phone_end - phone_begin),
         .after = time)

formant_data <- formant_data %>%
  summarize(across(c(F1:B3),
                ~ approx(x = time.rel,
                         y = .x,
                         xout = measurement_point)$y),
            .by = c(phone_id, phone)) %>%
  mutate(time.rel = measurement_point)

formant_data <- formant_data %>%
  mutate(across(c(B1, B2, B3),
                 ~ log10(.x)))

formant_data <- formant_data[, c('phone', proto_parameters)]

# Calculate the means and covariance matrices
corpus_means_for_phones <- formant_data %>%
  group_by(phone) %>%
  summarize(across(where(is.numeric), mean))

corpus_covmats_list <- list()

for (p in unique(formant_data$phone)) {
  corpus_covmats_list[[p]] <- formant_data %>%
    filter(phone == p) %>%
    select(F1:B3) %>%
    cov()
}

# Format the covariance matrices for the output and combine them with the means
corpus_covmats <- c()

for(p in names(corpus_covmats_list)){
  phone_matrix <- corpus_covmats_list[[p]]

  corpus_covmats <- rbind(corpus_covmats, data.frame(phone = p, phone_matrix))
}

phones_for_polyglot <- rbind(data.frame(type = 'means', corpus_means_for_phones), data.frame(type = 'matrix', corpus_covmats))

names(phones_for_polyglot)[names(phones_for_polyglot) %in% proto_parameters] <-
  paste(names(phones_for_polyglot)[names(phones_for_polyglot) %in% proto_parameters], measurement_point, sep='_')

# Make the prototype files
phones_for_polyglot %>%
  write_csv(prototypes_path)
ii. Measuring formants
We now call the analyze_formant_points_refinement() function in PolyglotDB, specifying a few additional parameters:
output_tracks = True(default:false), to extract formant tracks with measures every 10 ms (rather than point measures at 33% of duration),vowel_label = 'vowel'(default:vowel), to specify the subset of phone for which formant measures are desired for (the subset must already have been encoded as a property of phones in the corpus, as in step 2),duration_threshold = 0.05(default:0), to skip vowels shorter than 50 ms in duration (we would have excluded these from the analysis later anyway, as they are likely too reduced),num_iterations = 20(default:1), to set the maximum number of iterations of the algorithm for each speaker-vowel pair (if there is no change in output from one iteration to the next, the algorithm is considered to have ‘converged’ and will end early),vowel_prototypes_path = vowel_prototypes_path(default:''), to set the path to the prototypes CSV file,
This function first determines the optimal parameters for each phone using point measures taken at the 1/3 point. It then uses these parameters to calculate formant tracks, taking measures every 10 ms.
Note
Mielke et al. [2019] describe a second version of the formant refinement algorithm which considers additional candidate analyses for each phone: new candidates are created from the aforementioned ones by ‘dropping’ one of the formants, in an attempt to remove any false formants which may have been accidentally tracked. This version of the algortihm can be enabled by passing the drop_formant = True argument to analyze_formant_points_refinement. It appears to largely depend on the data which version of the algortihm performs better–or indeed, whether there’s an appreciable difference in performance at all. We encourage users to experiment with both methods.
from polyglotdb import CorpusContext
from polyglotdb.acoustics.formants.refined import analyze_formant_points_refinement


def main():
    corpus_name = "ParlBleu-subset"
    vowel_prototypes_path = "./ParlBleu-subset/enrichment_data/prototypes.csv"  # Change this if using different prototypes

    with CorpusContext(corpus_name) as c:
        # Set this for your computer
        c.config.praat_path = "/Applications/Praat.app/Contents/MacOS/Praat"

        print("Refined formant calculations...")
        analyze_formant_points_refinement(
            c,
            vowel_label="vowel",
            duration_threshold=0.05,
            num_iterations=20,
            vowel_prototypes_path=vowel_prototypes_path,
            output_tracks=True,
        )


if __name__ == "__main__":
    main()
Option C: Using external software
For many reasons, you may prefer to perform the formant analysis outside of PolyglotDB. For example, you may have a relatively small dataset, where ensuring that all formant tracks are accurate is important and hand-checking all measures is feasible.
The details of how to make this work will likely differ slightly depending on the software you intend to use. If using Fast Track, the first three scripts shown above in step i of Option B can be adapted with minimal modifications: only the corpus restructuring script needs to be modified to remove the sampling logic. You may then skip directly to step 5.
Step 4: Querying
We now run a simple query to get all vowel tokens in word-final syllables (the accented position in French) that are at least 50 ms long. There are 7474 tokens in the corpus matching these criteria.
By default, the query will output every measurement from the beginning to the end of the vowel: accordingly, the number of measurements will vary from one track to another. It is often more convenient for analyses to interpolate formant tracks to a consistent number of points: PolyglotDB provides built-in functionality for this, which we take advantage of here (interpolating to 9 points).
from polyglotdb import CorpusContext


def main():
    corpus_name = "ParlBleu-subset"
    export_path = "./output/formants-refined.csv"

    print("Querying all word-final-syllable vowel tokens >= 50 ms in duration...")
    with CorpusContext(corpus_name) as c:
        q = c.query_graph(c.phone).filter(
            c.phone.syllable.end == c.phone.word.end,
            c.phone.subset == "vowel",
            c.phone.duration >= 0.05,
        )

        formants = c.phone.formants

        # Use this code if uninterpolated formant tracks are desired (make sure to comment out the next set of lines lines)
        # formants.relative_time = False
        # formants_track = formants.track

        # Use this code for interpolated formant tracks
        formants.relative_time = True
        formants_track = formants.interpolated_track
        formants_track.num_points = 9  # Change this as desired

        q = q.columns(
            c.phone.utterance.speaker.name.column_name("speaker"),
            c.phone.discourse.name.column_name("discourse"),
            c.phone.utterance.speaker.gender.column_name("gender"),
            c.phone.utterance.speaker.yob.column_name("yob"),
            c.phone.id.column_name("phone_id"),
            c.phone.label.column_name("phone"),
            c.phone.syllable.label.column_name("syllable"),
            c.phone.word.label.column_name("word"),
            c.phone.word.transcription.column_name("transcription"),
            c.phone.begin.column_name("phone_begin"),
            c.phone.end.column_name("phone_end"),
            formants_track,
        )
        q.order_by(c.phone.discourse.name)
        q.to_csv(export_path)


if __name__ == "__main__":
    main()
Step 5: Analysis
Finally, we use an R script to plot the average position of all phones in F1 × F2 space. We exmaine only the middle portion of the vowel here (the endpoints are not always theoretically interesting, as they can be disporprotionately affected by coarticulation with surrounding vowels). We draw the vowel label at the 25% timepoint: this is also the beginning of an arrow whose head points to the 75% timepoint.
library(tidyverse)
theme_set(theme_bw()) # Sets the ggplot2 theme

vowels <- read_csv('output/formants-refined.csv') # Change this path as needed

# Average each phone first within, then across speakers (because data is imbalanced)
phone_means <- vowels %>%
  filter(time >= 0.25 & time <= 0.75) %>%
  summarize(across(F1:F3,
                   ~ mean(.x, na.rm = TRUE)),
            .by = c(phone, speaker, gender, time)) %>%
  summarize(across(F1:F3,
                   ~ mean(.x, na.rm = TRUE)),
            .by = c(phone, time))

# Make the vowel space plot
vowel_space <- phone_means %>%
  ggplot(aes(x = F2, y = F1)) +
  geom_path(aes(colour = phone), linewidth = 0.5, arrow = arrow(length = unit(0.1, 'cm'), type = 'closed')) +
  geom_label(data = phone_means %>% slice_min(time, by = phone), aes(label = phone), size = 1.5) +
  scale_x_reverse() +
  scale_y_reverse() +
  labs(x = 'F2 (Hz)',
       y = 'F1 (Hz)') +
  theme(legend.position = 'none')

vowel_space

# Save the plot
vowel_space %>% ggsave('./vowel-space.png', ., width = 800, height = 600, unit = 'px')
This gives the following plot:
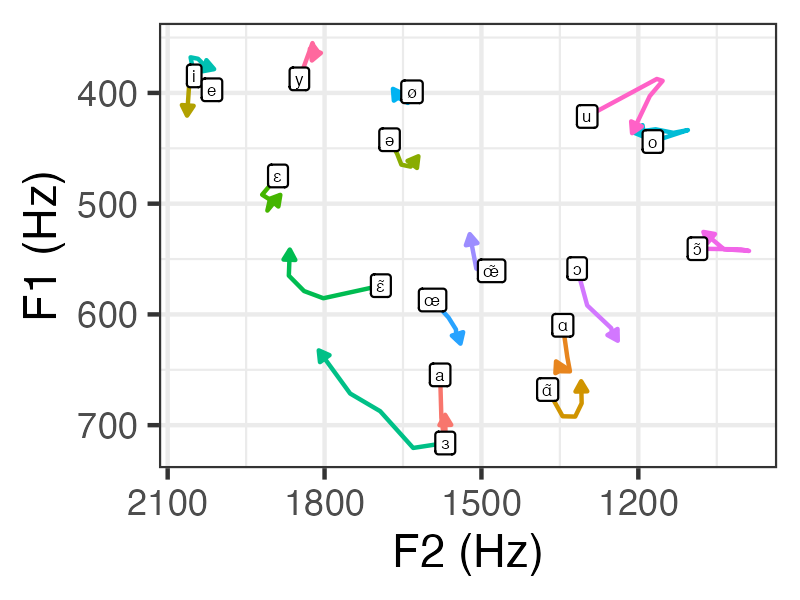
This vowel space looks fairly reasonable (cf. MacKenzie and Sankoff, 2010). This is despite only 6 speakers being represented, very few controls for nuisance variables having been included, and no speaker normalization having been performed!